Abstract
The leading AI models keep getting more expensive, but are they worth it? I benchmarked dozens of LLMs across coding and general reasoning tasks, then mapped their performance against API pricing. The results are striking: a handful of models—most notably DeepSeek V3.2 and Minimax 2.5—deliver 85–95% of frontier performance at a fraction of the cost. Meanwhile, premium models like Claude 4.6 Opus and GPT-5.2 fight over margins so thin they're often within statistical noise. In this post, I break down the rankings, highlight the best value picks in each category, and argue that for most production workloads, the smartest choice isn't the most expensive — it's the one that gives you the most intelligence per dollar.
Update (Feb 18 2026): Things are evolving so rapidly that this post would need updating every couple of days. For the latest LLM rankings compiled from several benchmarks using the methodology outlined here, visit this page.
Introduction
Large Language Models (LLMs) are incredibly useful, but is it necessary to spend over $100 to achieve high-level performance? How do the recent open-weights models released by Chinese companies compare to major players like GPT, Claude, and Gemini?
To answer these questions, I conducted a statistical analysis of LLM rankings. My specific goals were:
- Derive the average ranking of models from multiple LLM leaderboards.
- Group models into tiers with similar performance levels.
- Plot model performance against relative cost to identify which models offer performance comparable to top-tier options at a lower price.
By analyzing the results, we can identify the highest-performing models as well as those offering the optimal cost-benefit ratio.
Method
<h3 id=benchmark-selection-and-data-collection>Benchmark selection and data collection</h3><p>I manually collected model rankings from established LLM leaderboards on February 11, 2026, choosing benchmarks that cover different evaluation angles.</p>
General reasoning draws on four leaderboards:
- LiveBench — regularly refreshed, multi-domain evaluation designed to resist contamination
- Arena — ELO-style ranking from blind human preference votes (a popular-preference signal rather than a strict accuracy benchmark, but informative nonetheless)
- Artificial Analysis Intelligence Index — a composite of 10 evaluations including GPQA Diamond, Humanity's Last Exam, SciCode, and others
- Scale's Humanity's Last Exam — expert-level reasoning questions
Coding and agentic coding draws on seven leaderboards:
I selected 22 models spanning the current frontier: proprietary leaders from OpenAI (GPT-5.x family), Anthropic (Claude 4.x family), Google (Gemini 3), and xAI (Grok 4.x), plus open-weights challengers from DeepSeek, Moonshot AI (Kimi), Z AI (GLM), MiniMax, Alibaba (Qwen3), and Meta (Llama 4).
<h3 id=percentile-normalization>Percentile normalization</h3><p>Different leaderboards evaluate different numbers of models. Being ranked 5th out of 600 models is far more impressive than 5th out of 30. To make cross-benchmark comparisons fair, I normalize each rank to a fractional percentile:</p>
This puts every score on a 0–1 scale (0 = best, 1 = worst). A model that's 3rd out of 600 on Arena (percentile 0.005) and 2nd out of 50 on LiveBench (percentile 0.04) now live on the same axis.
<h3 id=aggregation-and-penalties>Aggregation and penalties</h3><p>A model’s composite score is the unweighted arithmetic mean of its percentiles across all benchmarks it appears on. To avoid boosting the ranking of a model that happens to score well on the single benchmark it was evaluated on, a sparse-data penalty is added: +0.25 for one benchmark, +0.10 for two, and zero for three or more.</p> <h3 id=statistical-tiering>Statistical tiering</h3><p>Rather than treating every rank difference as meaningful, I group models into tiers using the “indistinguishable from best” method:</p>
- The best model becomes the tier leader.
- Every remaining model whose confidence interval overlaps with the leader's joins the same tier.
- Remove the tier, promote the next-best model to leader, and repeat.
Formally, model i is grouped with leader j if:
In plain terms: if B's best-case performance could plausibly reach A's worst-case, we can't confidently distinguish them. This acknowledges that benchmark scores carry noise and avoids drawing artificial distinctions where the evidence doesn't support them. Models evaluated on fewer than two benchmarks have no standard deviation, so the average σ across all other models is used as a stand-in.
<h3 id=cost-metric>Cost metric</h3><p>For consistent cost comparison, I use the credit cost per 1,000 tokens from a single API provider (Poe) as a uniform pricing reference. Absolute dollar costs vary by provider and plan, but this gives a stable relative comparison across all models on the same platform.</p>
Results
<h3 id=general-reasoning-a-crowded-tier-1>General reasoning: a crowded Tier 1</h3><p>The general reasoning ranking, aggregated across four leaderboards, reveals a tight race at the top—and a perhaps surprising amount of statistical ambiguity below it.</p>
| Rank | Model | Avg Pctl | Std Dev | # Benchmarks | Cost/1k |
| 1 | opus46 | 0.027 | 0.027 | 4 | 850 |
| 2 | gpt52 | 0.029 | 0.018 | 4 | 470 |
| 3 | gemini-pro3 | 0.038 | 0.044 | 4 | 370 |
| 4 | kimi25 | 0.073 | 0.068 | 4 | 120 |
| 5 | glm5 | 0.076 | 0.077 | 4 | 140 |
| 6 | grok | 0.100 | 0.117 | 3 | 600 |
| 7 | deepseek32 | 0.116 | 0.090 | 4 | 23 |
| 8 | gemini-flash3 | 0.125 | 0.134 | 4 | 100 |
| 9 | gpt-codex53 | 0.143 | 0.033 | 2 | 470 |
| 10 | sonnet45 | 0.156 | 0.135 | 4 | 500 |
| 11 | grok-fast41 | 0.158 | 0.143 | 3 | 20 |
| 12 | minimax25 | 0.180 | 0.172 | 4 | 50 |
| 13 | gpt-pro52 | 0.209 | 0.061 | 2 | 5600 |
| 14 | qwen3-235b | 0.216 | 0.221 | 3 | 300 |
| 15 | qwen3-80b | 0.254 | 0.235 | 3 | N/A |
| 16 | gpt-oss-20b | 0.298 | N/A | 1 | 15 |
| 17 | gpt-oss-120b | 0.376 | 0.294 | 3 | 40 |
| 18 | gpt-instant52 | 0.383 | 0.208 | 3 | 470 |
| 19 | llama-maverick | 0.395 | 0.242 | 2 | 55 |
| 20 | haiku45 | 0.580 | 0.293 | 2 | 170 |
| 21 | qwen3-32b | 0.636 | 0.276 | 2 | N/A |
| 22 | qwen3-coder-30b | 0.720 | 0.173 | 2 | 50 |
The top three are virtually tied. Opus 4.6, GPT-5.2, and Gemini 3 Pro are in the top 4% of every leaderboard. The gap separating first from third is roughly one percentile point.
But the real headline is how wide Tier 1 is. The statistical tiering places the majority of models—12 of 22—in the top tier. The reason: with only four benchmarks, many models exhibit high cross-benchmark variance. A model might rank 2nd on Arena but 15th on Humanity's Last Exam. The resulting confidence intervals are wide enough to overlap with the leader's. The practical implication is that for general reasoning, the measurable performance gap between the best model and the 12th-best model is smaller than the noise in the measurements. When you use these models, you can clearly notice the superiority in performance between the top model (Opus 4.6) ones and say the 7th model (DeepSeek 3.2). But this is what the statistics is telling us.
When performance is a wash, cost becomes the story. The plot below makes this vivid:
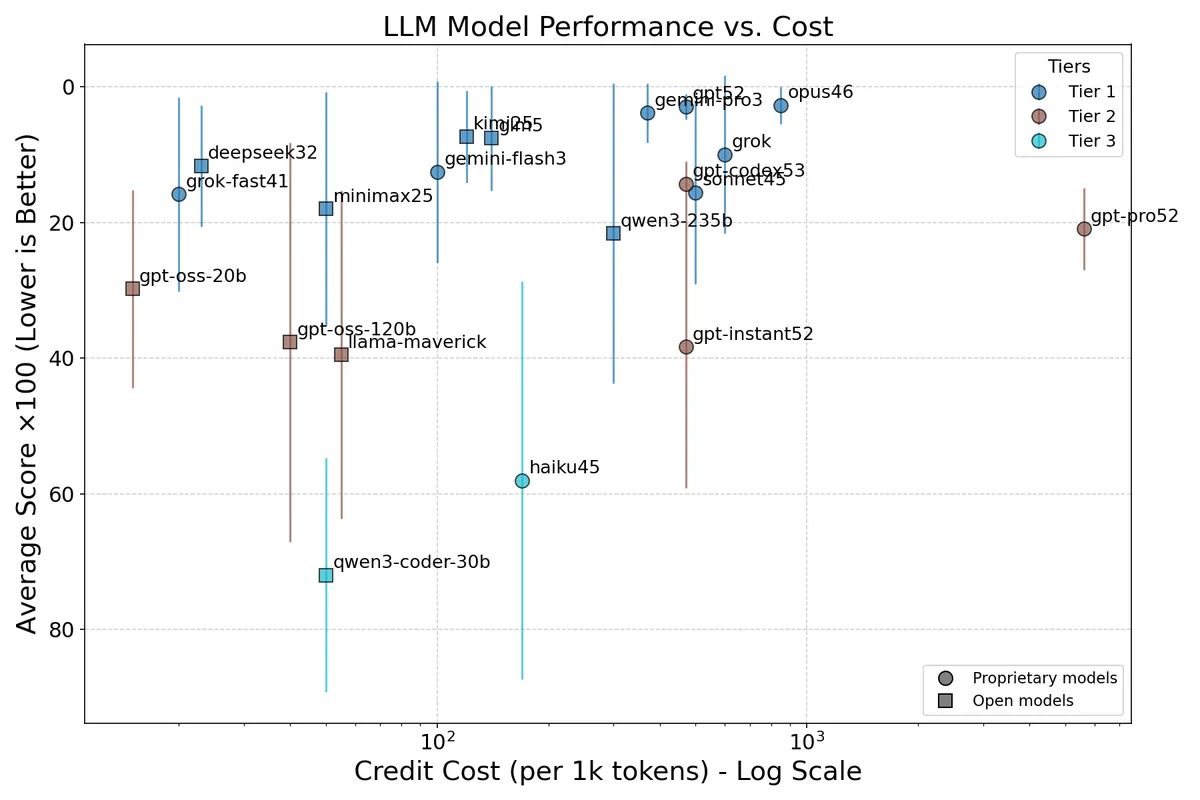 Figure 1: General intelligence ranking. Credit cost (log scale) on the x-axis and average percentile score on the y-axis (inverted, so the best models appear at the top). Error bars show ±1σ. Colors indicate statistical tier. Circles mark proprietary models; squares mark open-weights models. The upper-left corner is the sweet spot: best performance at lowest cost.
The entire Tier 1 cluster (blue) spans from 20 credits (Grok 4.1 Fast) to 850 credits (Claude Opus 4.6)—a 42× cost difference—while delivering statistically indistinguishable average performance. Meanwhile, GPT-5.2 Pro at 5,600 credits per 1k tokens (the rightmost point) sits in Tier 2, spending 243× more than the cheapest Tier 1 model for measurably worse average results. Its extended reasoning budget may help on specific hard reasoning tasks, but that advantage is diluted when averaged across diverse evaluations.
The “general reasoning” value picks:
| Model | General rank | Cost | Note |
| Kimi K2.5 | 4 | 120 | Top 5 at 7× less than Opus |
| GLM-5 | 5 | 140 | Matches Kimi at similar price; open weights |
| DeepSeek V3.2 | 7 | 23 | Tier 1 performance at 37× less than Opus |
| Grok 4.1 Fast | 11 | 20 | Cheapest Tier 1 model; high variance though (σ = 0.143) |
| MiniMax M2.5 | 12 | 50 | Solid mid-tier at 17× less than Opus |
| Gemini 3 Pro | 3 | 370 | If you want a top-3 model, it's the cheapest of the three |
<h3 id=coding-and-agentic-coding-opus-stands-out>Coding and agentic coding: Opus stands out</h3><p>The coding ranking, drawn from seven benchmarks including demanding agentic evaluations, tells a more subtle story.</p>
| Rank | Model | Avg Pctl | Std Dev | # Benchmarks | Cost/1k |
| 1 | opus46 | 0.017 | 0.016 | 7 | 850 |
| 2 | gpt-codex53 | 0.038 | 0.027 | 6 | 470 |
| 3 | gemini-pro3 | 0.043 | 0.033 | 7 | 370 |
| 4 | gpt52 | 0.065 | 0.056 | 7 | 470 |
| 5 | gpt-pro52 | 0.096 | 0.132 | 3 | 5600 |
| 6 | gemini-flash3 | 0.103 | 0.089 | 7 | 100 |
| 7 | sonnet45 | 0.113 | 0.135 | 7 | 500 |
| 8 | kimi25 | 0.128 | 0.136 | 7 | 120 |
| 9 | glm5 | 0.130 | 0.201 | 7 | 140 |
| 10 | minimax25 | 0.155 | 0.162 | 6 | 50 |
| 11 | deepseek32 | 0.237 | 0.222 | 7 | 23 |
| 12 | haiku45 | 0.240 | 0.204 | 5 | 170 |
| 13 | grok | 0.282 | 0.288 | 5 | 600 |
| 14 | grok-fast41 | 0.301 | 0.300 | 5 | 20 |
| 15 | llama-maverick | 0.306 | 0.257 | 4 | 55 |
| 16 | gpt-instant52 | 0.321 | 0.292 | 5 | 470 |
| 17 | gpt-oss-120b | 0.344 | 0.282 | 5 | 40 |
| 18 | mistral | 0.347 | N/A | 1 | 400 |
| 19 | qwen3-80b | 0.350 | 0.346 | 3 | N/A |
| 20 | qwen3-235b | 0.375 | 0.262 | 6 | 300 |
| 21 | qwen3-coder-30 | 0.460 | 0.348 | 5 | 50 |
| 22 | gpt-oss-20b | 0.489 | 0.355 | 3 | 15 |
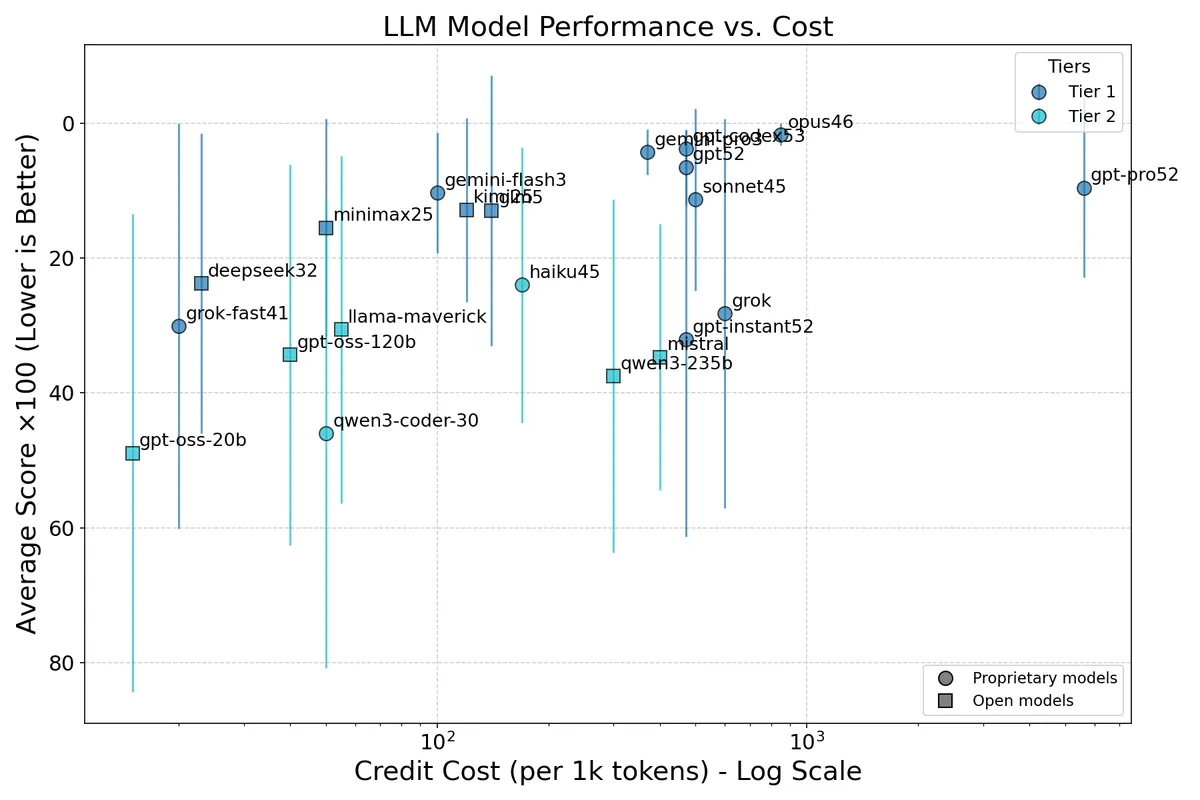 Figure 2: Coding and agentic coding ranking. Notation is the same as in Figure 1.
Claude Opus 4.6 is the clear coding champion. It consistently lands in the top 3% across all seven coding benchmarks—a level of reliability no other model matches. GPT-5.3 Codex and Gemini 3 Pro are also strong, but notice how Opus's standard deviation is roughly half of theirs.
Agentic benchmarks expose inconsistencies. Several models that score well on traditional coding tasks (function calling, SWE-bench Verified) stumble on agentic evaluations like Terminal-Bench 2.0 and SWE-Bench Pro, where the model must navigate multi-step tool use and environment interaction. Several models (e.g. GLM-5 with , Grok with ) show particularly high variance—their best and worst benchmark performances differ by an order of magnitude in percentile terms. Pure code generation ability doesn't reliably predict agentic coding performance.
The “coding” value picks:
| Model | Coding rank | Cost | Note |
| Kimi K2.5 | 8 | 120 | Consistently solid across all 7 benchmarks |
| MiniMax M2.5 | 10 | 50 | 17× cheaper than Opus |
| Gemini 3 Flash | 6 | 100 | |
| DeepSeek V3.2 | 11 | 23 | Competitive at a tiny fraction of the cost |
<h3 id=other-observations>Other observations</h3><p>Consistency across the two rankings. Claude Opus 4.6 is #1 in both. GPT-5.2 is #2 in general but #4 in coding (the specialized Codex variant takes #2 there). Gemini 3 Pro is #3 in both—arguably the most balanced model overall. The biggest mover is Grok 4, which lands at #6 in general reasoning but drops to #13 in coding, suggesting its strengths are more on the reasoning side than the code generation side.</p>
The Chinese open-weights models are the story of this analysis. Four models—Kimi K2.5, GLM-5, DeepSeek V3.2, and MiniMax M2.5—land in the top 12 for both general reasoning and coding. Their average cost is approximately 83 credits per 1k tokens, roughly 10× less than the Big Three models (Opus, GPT-5.2, Gemini 3 Pro) average of ~560 credits. They are especially compelling if you can tolerate somewhat higher variance—they're brilliant on some benchmarks, merely good on others—compared to the more uniform excellence of the priciest proprietary models.
The notable exception among Chinese models is Qwen3: the 235B variant ranks 14th in general and 20th in coding; the smaller Coder 30B model is near the bottom of both lists.
Cost scales much faster than quality. Going from DeepSeek V3.2 (23 credits) to Opus 4.6 (850 credits) is a 37× price increase that buys roughly a 4× improvement in average general reasoning percentile (0.116 → 0.027). Spending further to reach GPT-5.2 Pro (5,600 credits)—another 6.6× cost increase—actually makes things worse on average (0.209 percentile). The diminishing returns curve is brutally steep at the high end.
Conclusions
- If you need the absolute best coding reliability and can afford it, Claude Opus 4.6 earns its price.
- For general reasoning, you have several options: Kimi K2.5 or GLM-5 deliver Tier 1 performance at a fraction of the cost.
- For coding and agentic coding (e.g. opencode), there are many options with great value: Gemini Flash 3, Kimi K2.5, GLM-5 and MiniMax M2.5.
- If budget is the primary concern, DeepSeek V3.2 at 23 credits per 1k tokens is the standout value of this generation—statistically indistinguishable from the leaders on general reasoning, and still in the top half for coding, at roughly the cost of a rounding error.
Reproducibility
All code, data files, and full methodology details are here. You can reproduce the rankings with
# General ranking
python rank_models.py ranks_general.txt --plot
# Coding ranking
python rank_models.py ranks_coding.txt --plot
These results correspond to commit 423486a1e0328.
Changelog
Feb 13 2026: Light introduction revision (phrasing).
Feb 14 2026: Minor formatting fixes.
Feb 15: I realized that the https://artificialanalysis.ai index shows only a selection of models in their plots, so their ranking is a bit misleading. I fixed this and as a result the average rankings and tiers were slightly impacted. Conclusions are unchanged. For the latest plots, please see [this page]. Feb 18 2026: Added note pointing to updated website.