LLM ranking
LLM ranking including proprietary and open models
I benchmarked dozens of LLMs across coding and general reasoning tasks, then mapped their performance against API pricing. This page breaks down the rankings and highlight the best value picks in each category.
Updated on Feb. 25 2026.
Introduction
I conducted a statistical analysis of LLM rankings. My specific goals were:
- Derive the average ranking of models from multiple LLM leaderboards.
- Group models into tiers with similar performance levels.
- Plot model performance against relative cost to identify which models offer performance comparable to top-tier options at a lower price.
By analyzing the results, we can identify the highest-performing models as well as those offering the optimal cost-benefit ratio.
Results
General reasoning
The general reasoning ranking, aggregated across four leaderboards, reveals a tight race at the top—and a perhaps surprising amount of statistical ambiguity below it.
+------------------------------------------------------------------------------------+
| Rank  | Model                   | Avg Pctl  | Std Dev   | # Benchmarks  | Cost/1k  |
+------------------------------------------------------------------------------------+
| 1     | gemini-pro31            | 0.028     | 0.031     | 5             | 467      |
| 2     | opus46                  | 0.057     | 0.048     | 5             | 850      |
| 3     | sonnet46                | 0.123     | 0.104     | 4             | 510      |
| 4     | gpt52                   | 0.129     | 0.071     | 5             | 470      |
| 5     | gemini-pro3             | 0.133     | 0.096     | 5             | 370      |
| 6     | gpt-pro52               | 0.163     | 0.030     | 3             | 5700     |
| 7     | grok-fast41             | 0.198     | 0.098     | 4             | 24       |
| 8     | gpt-codex53             | 0.204     | 0.051     | 2             | 470      |
| 9     | qwen35                  | 0.224     | 0.136     | 3             | 86       |
| 10    | grok41                  | 0.226     | 0.156     | 5             | 600      |
| 11    | glm5                    | 0.229     | 0.123     | 5             | 140      |
| 12    | kimi25                  | 0.251     | 0.109     | 5             | 120      |
| 13    | qwen3-max               | 0.265     | 0.116     | 3             | 220      |
| 14    | gemini-flash3           | 0.286     | 0.263     | 5             | 100      |
| 15    | deepseek32              | 0.291     | 0.114     | 5             | 23       |
| 16    | haiku45                 | 0.358     | 0.121     | 3             | 170      |
| 17    | minimax25               | 0.428     | 0.153     | 4             | 50       |
| 18    | qwen3-235b              | 0.453     | 0.193     | 4             | 300      |
| 19    | qwen3-80b               | 0.462     | 0.179     | 3             | 80       |
| 20    | glm-flash47             | 0.521     | 0.100     | 2             | 17       |
| 21    | gpt-instant52           | 0.589     | 0.297     | 4             | 470      |
| 22    | qwen3-32b               | 0.607     | 0.170     | 3             | 40       |
| 23    | gpt-oss-120b            | 0.645     | 0.218     | 5             | 40       |
| 24    | llama-maverick          | 0.703     | 0.169     | 4             | 55       |
| 25    | gpt-oss-20b             | 0.826     | 0.092     | 2             | 15       |
| 26    | nemotron-nano3          | 0.885     | N/A       | 1             | 20       |
| 27    | qwen3-coder-30b         | 0.891     | N/A       | 1             | 50       |
+------------------------------------------------------------------------------------+
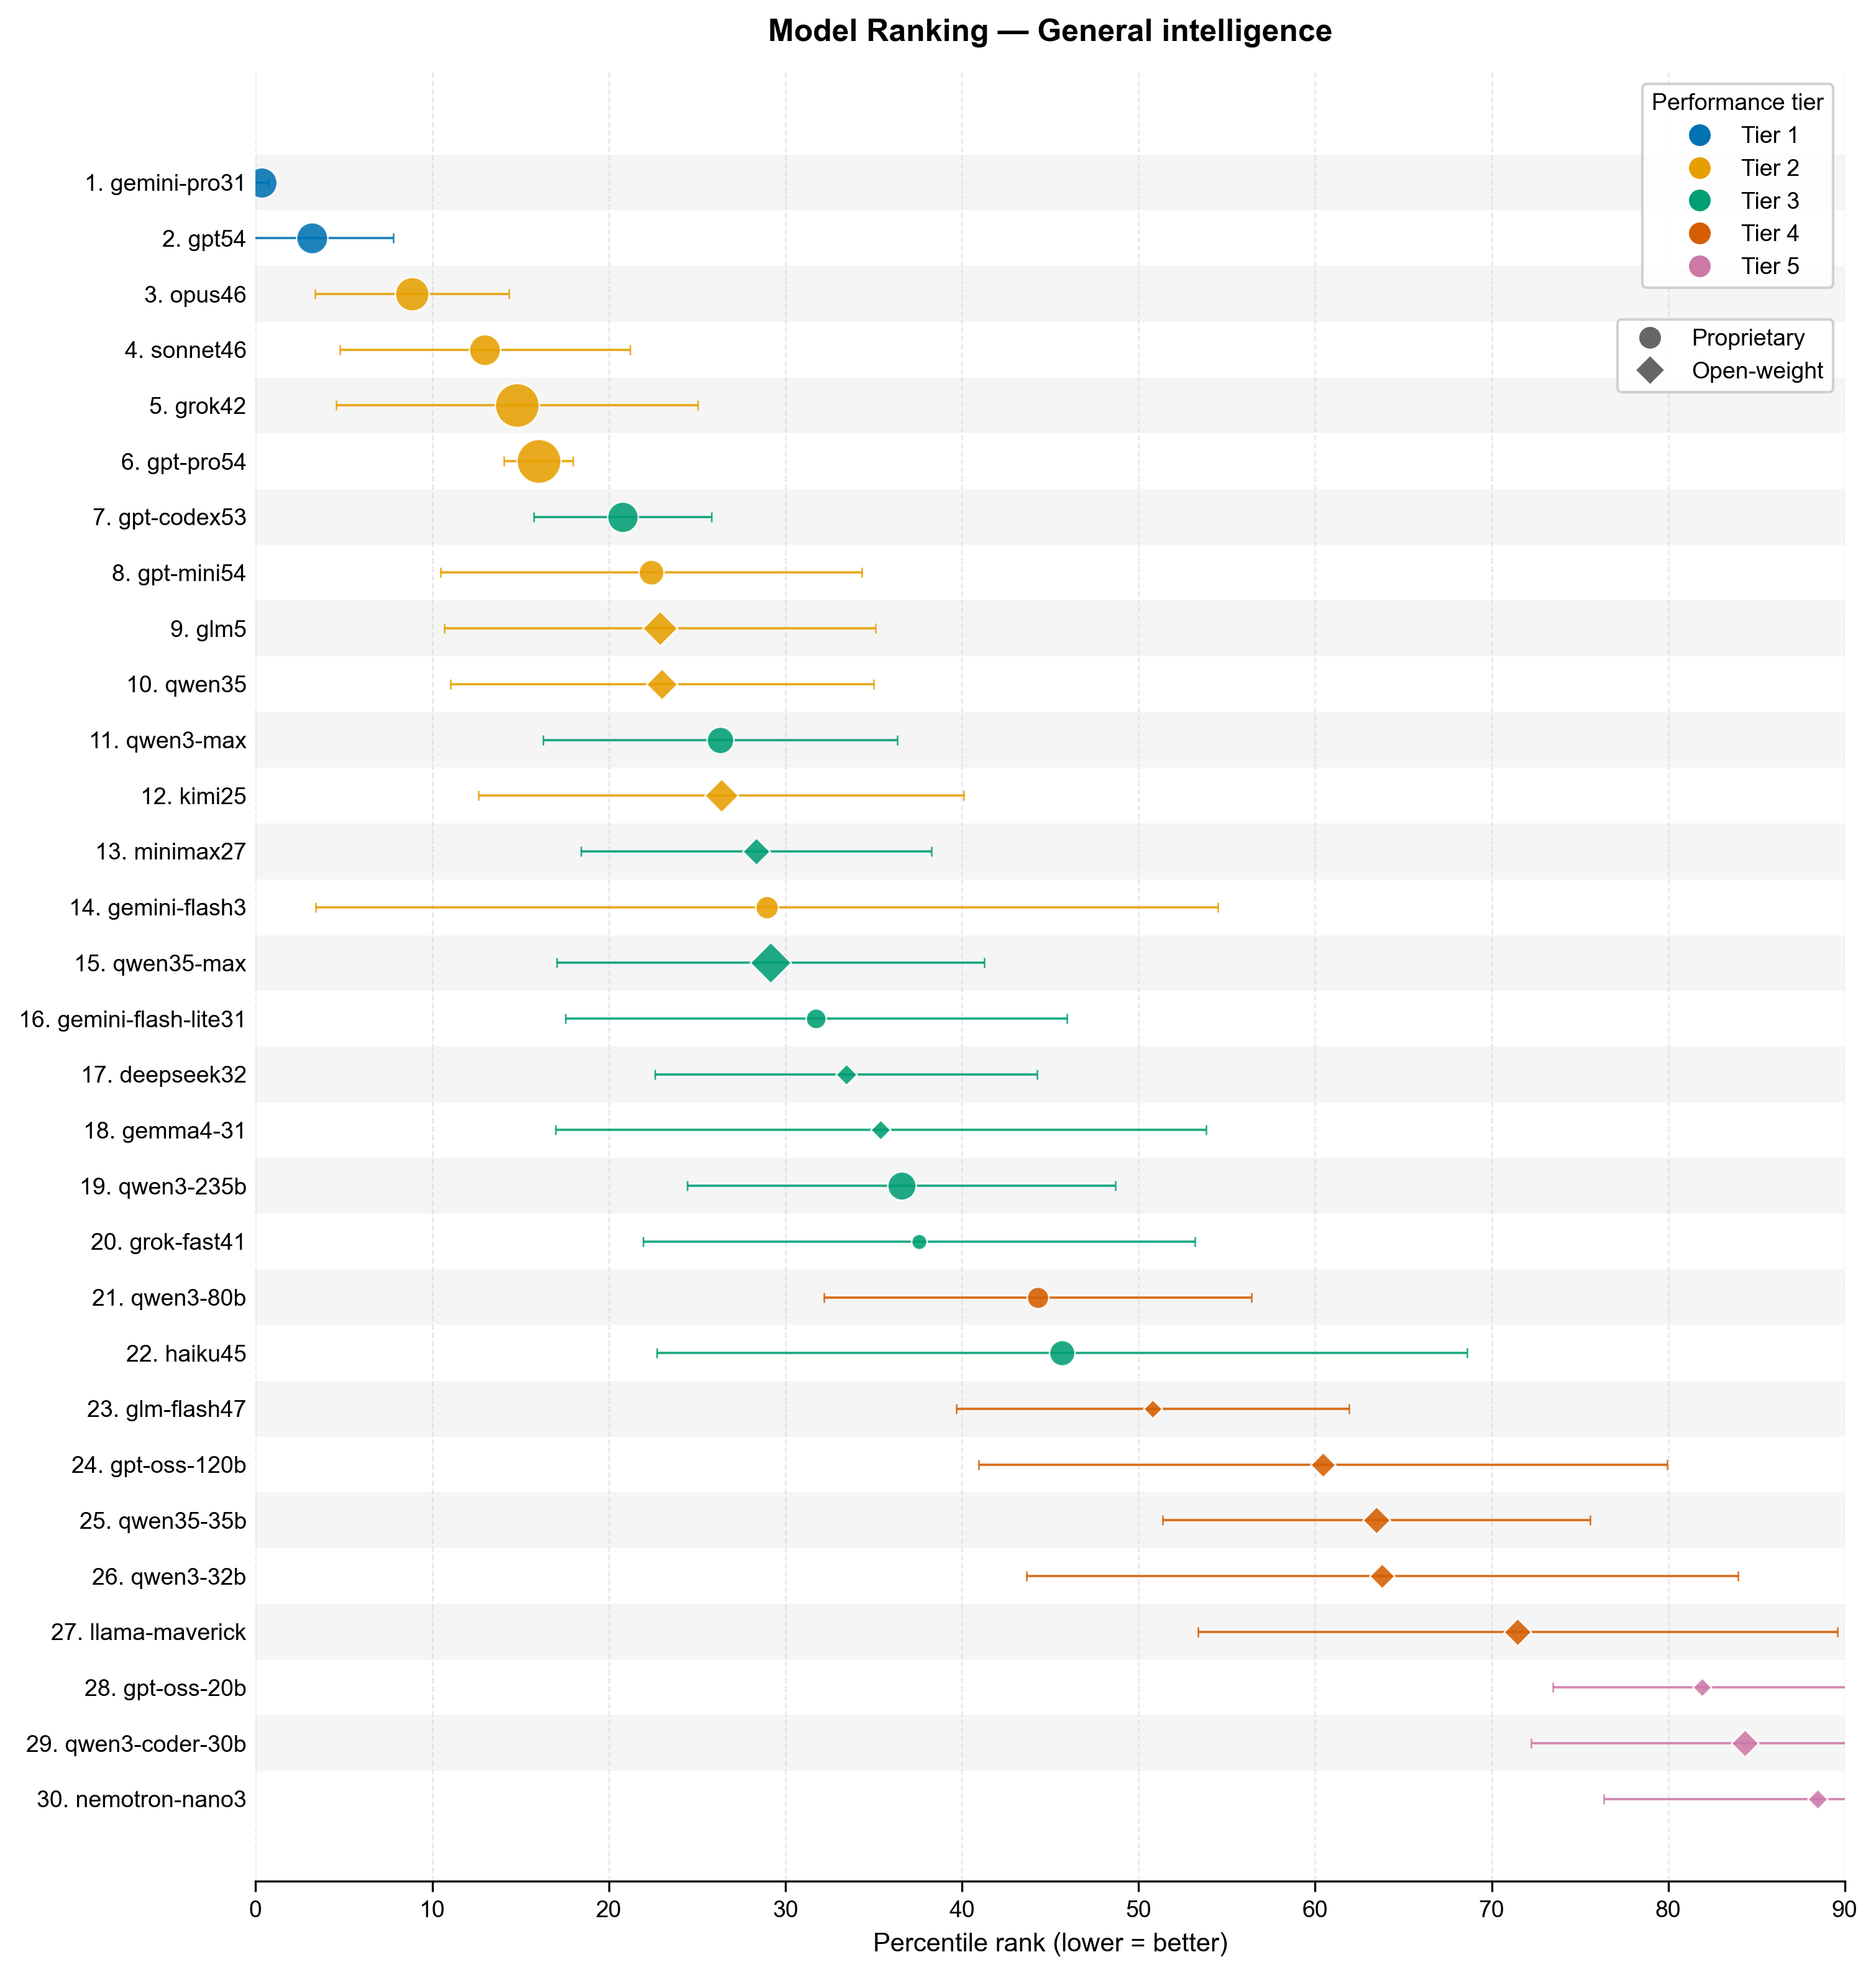
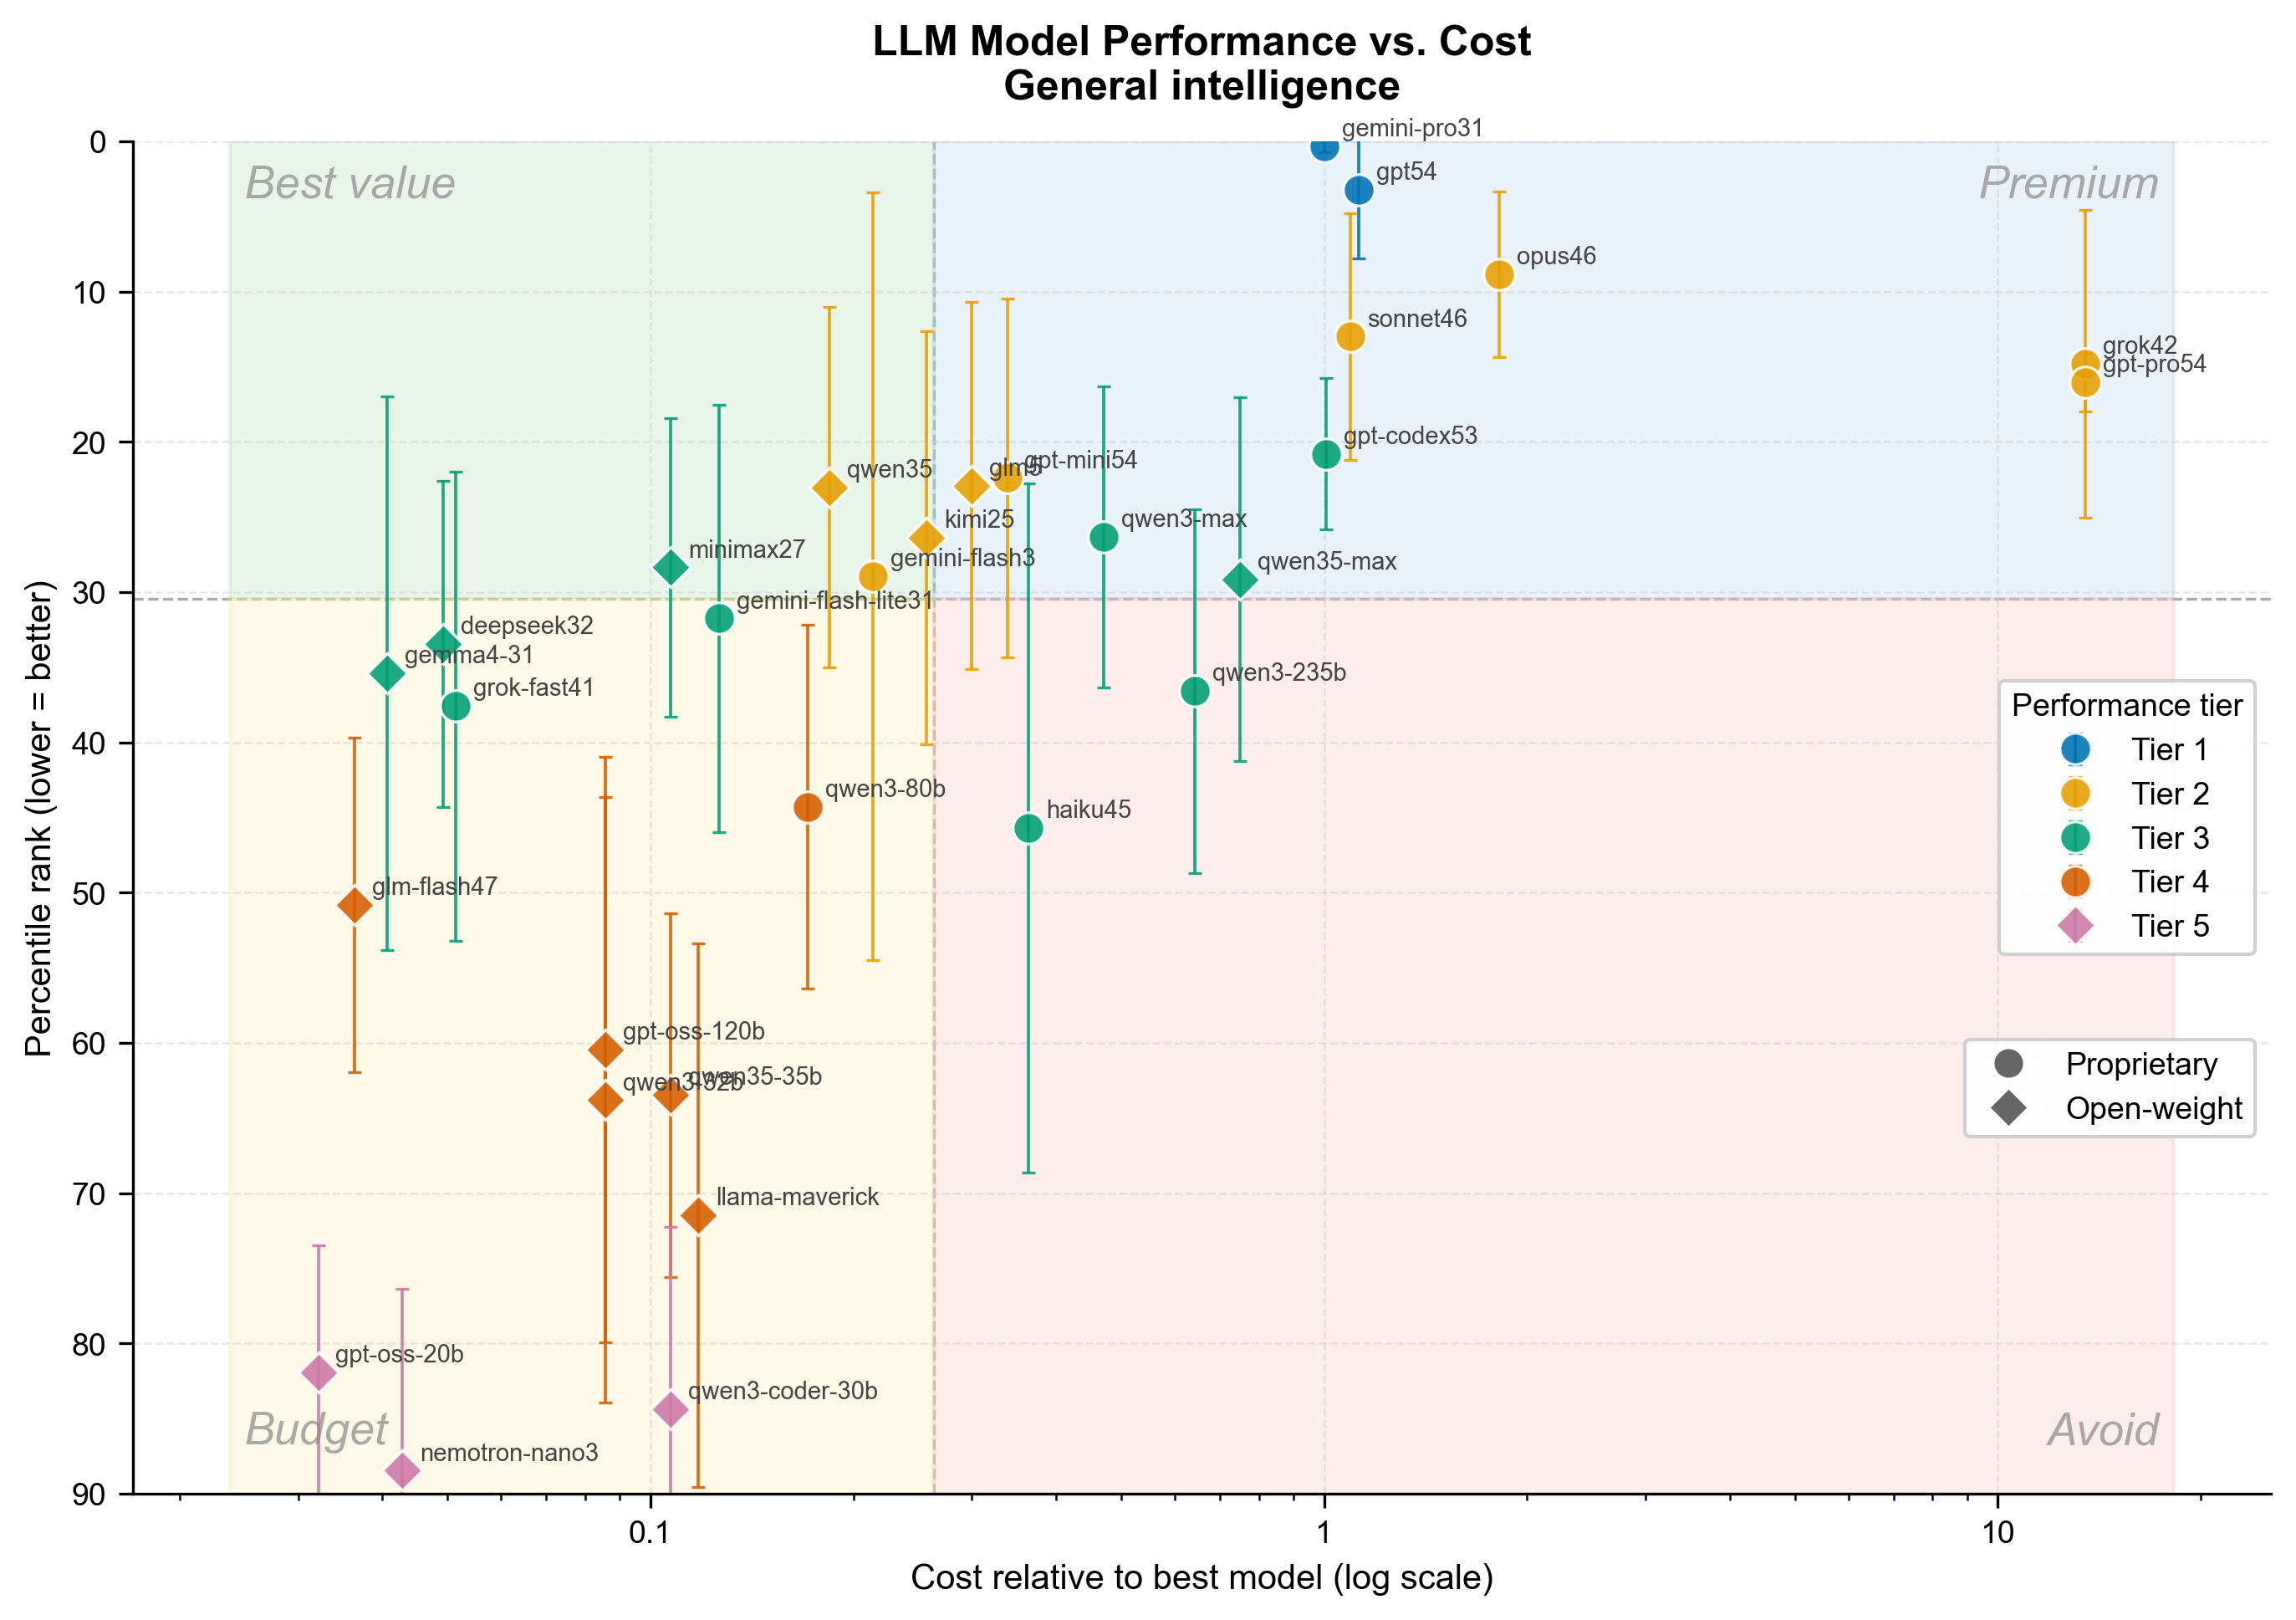
Figure 1. Left panel: Overall ranking. Circle size proportional to log10(API cost). Right panel: Credit cost (log scale) on the x-axis and average percentile score on the y-axis (inverted, so the best models appear at the top). The upper-left corner is the sweet spot: best performance at lowest cost. In both panels, error bars show ±1σ. Colors indicate statistical tier. Circles mark proprietary models; squares mark open-weights models.
Coding and agentic coding
The coding ranking, drawn from seven benchmarks including demanding agentic evaluations, tells a more subtle story.
+------------------------------------------------------------------------------------+
| Rank  | Model                   | Avg Pctl  | Std Dev   | # Benchmarks  | Cost/1k  |
+------------------------------------------------------------------------------------+
| 1     | opus46                  | 0.042     | 0.055     | 7             | 850      |
| 2     | sonnet46                | 0.085     | 0.076     | 7             | 510      |
| 3     | gemini-pro31            | 0.101     | 0.056     | 5             | 467      |
| 4     | glm5                    | 0.120     | 0.072     | 6             | 140      |
| 5     | gpt52                   | 0.132     | 0.065     | 7             | 470      |
| 6     | gemini-pro3             | 0.133     | 0.086     | 7             | 370      |
| 7     | gpt-codex53             | 0.172     | 0.222     | 6             | 473      |
| 8     | kimi25                  | 0.203     | 0.112     | 6             | 120      |
| 9     | qwen35                  | 0.210     | 0.111     | 4             | 86       |
| 10    | gemini-flash3           | 0.218     | 0.088     | 7             | 100      |
| 11    | gpt-pro52               | 0.258     | 0.158     | 2             | 5700     |
| 12    | minimax25               | 0.279     | 0.189     | 6             | 50       |
| 13    | qwen3-max               | 0.351     | 0.259     | 3             | 220      |
| 14    | deepseek32              | 0.352     | 0.162     | 7             | 23       |
| 15    | qwen35-27b              | 0.402     | 0.194     | 2             | 50       |
| 16    | haiku45                 | 0.416     | 0.224     | 7             | 170      |
| 17    | grok-fast41             | 0.463     | 0.303     | 4             | 20       |
| 18    | qwen3-235b              | 0.472     | 0.216     | 5             | 300      |
| 19    | glm-flash47             | 0.518     | 0.296     | 3             | 17       |
| 20    | grok41                  | 0.563     | 0.250     | 6             | 600      |
| 21    | gpt-instant52           | 0.618     | 0.242     | 6             | 470      |
| 22    | qwen3-coder-30b         | 0.699     | 0.259     | 4             | 50       |
| 23    | gpt-oss-120b            | 0.717     | 0.156     | 6             | 40       |
| 24    | llama-maverick          | 0.746     | 0.188     | 5             | 55       |
| 25    | gpt-oss-20b             | 0.790     | 0.185     | 4             | 15       |
| 26    | qwen3-32b               | 0.815     | 0.069     | 3             | 40       |
| 27    | qwen3-80b               | 0.819     | 0.096     | 3             | 80       |
| 28    | mistral                 | 0.880     | N/A       | 1             | 400      |
| 29    | nemotron-nano3          | 1.000     | N/A       | 1             | 20       |
+------------------------------------------------------------------------------------+
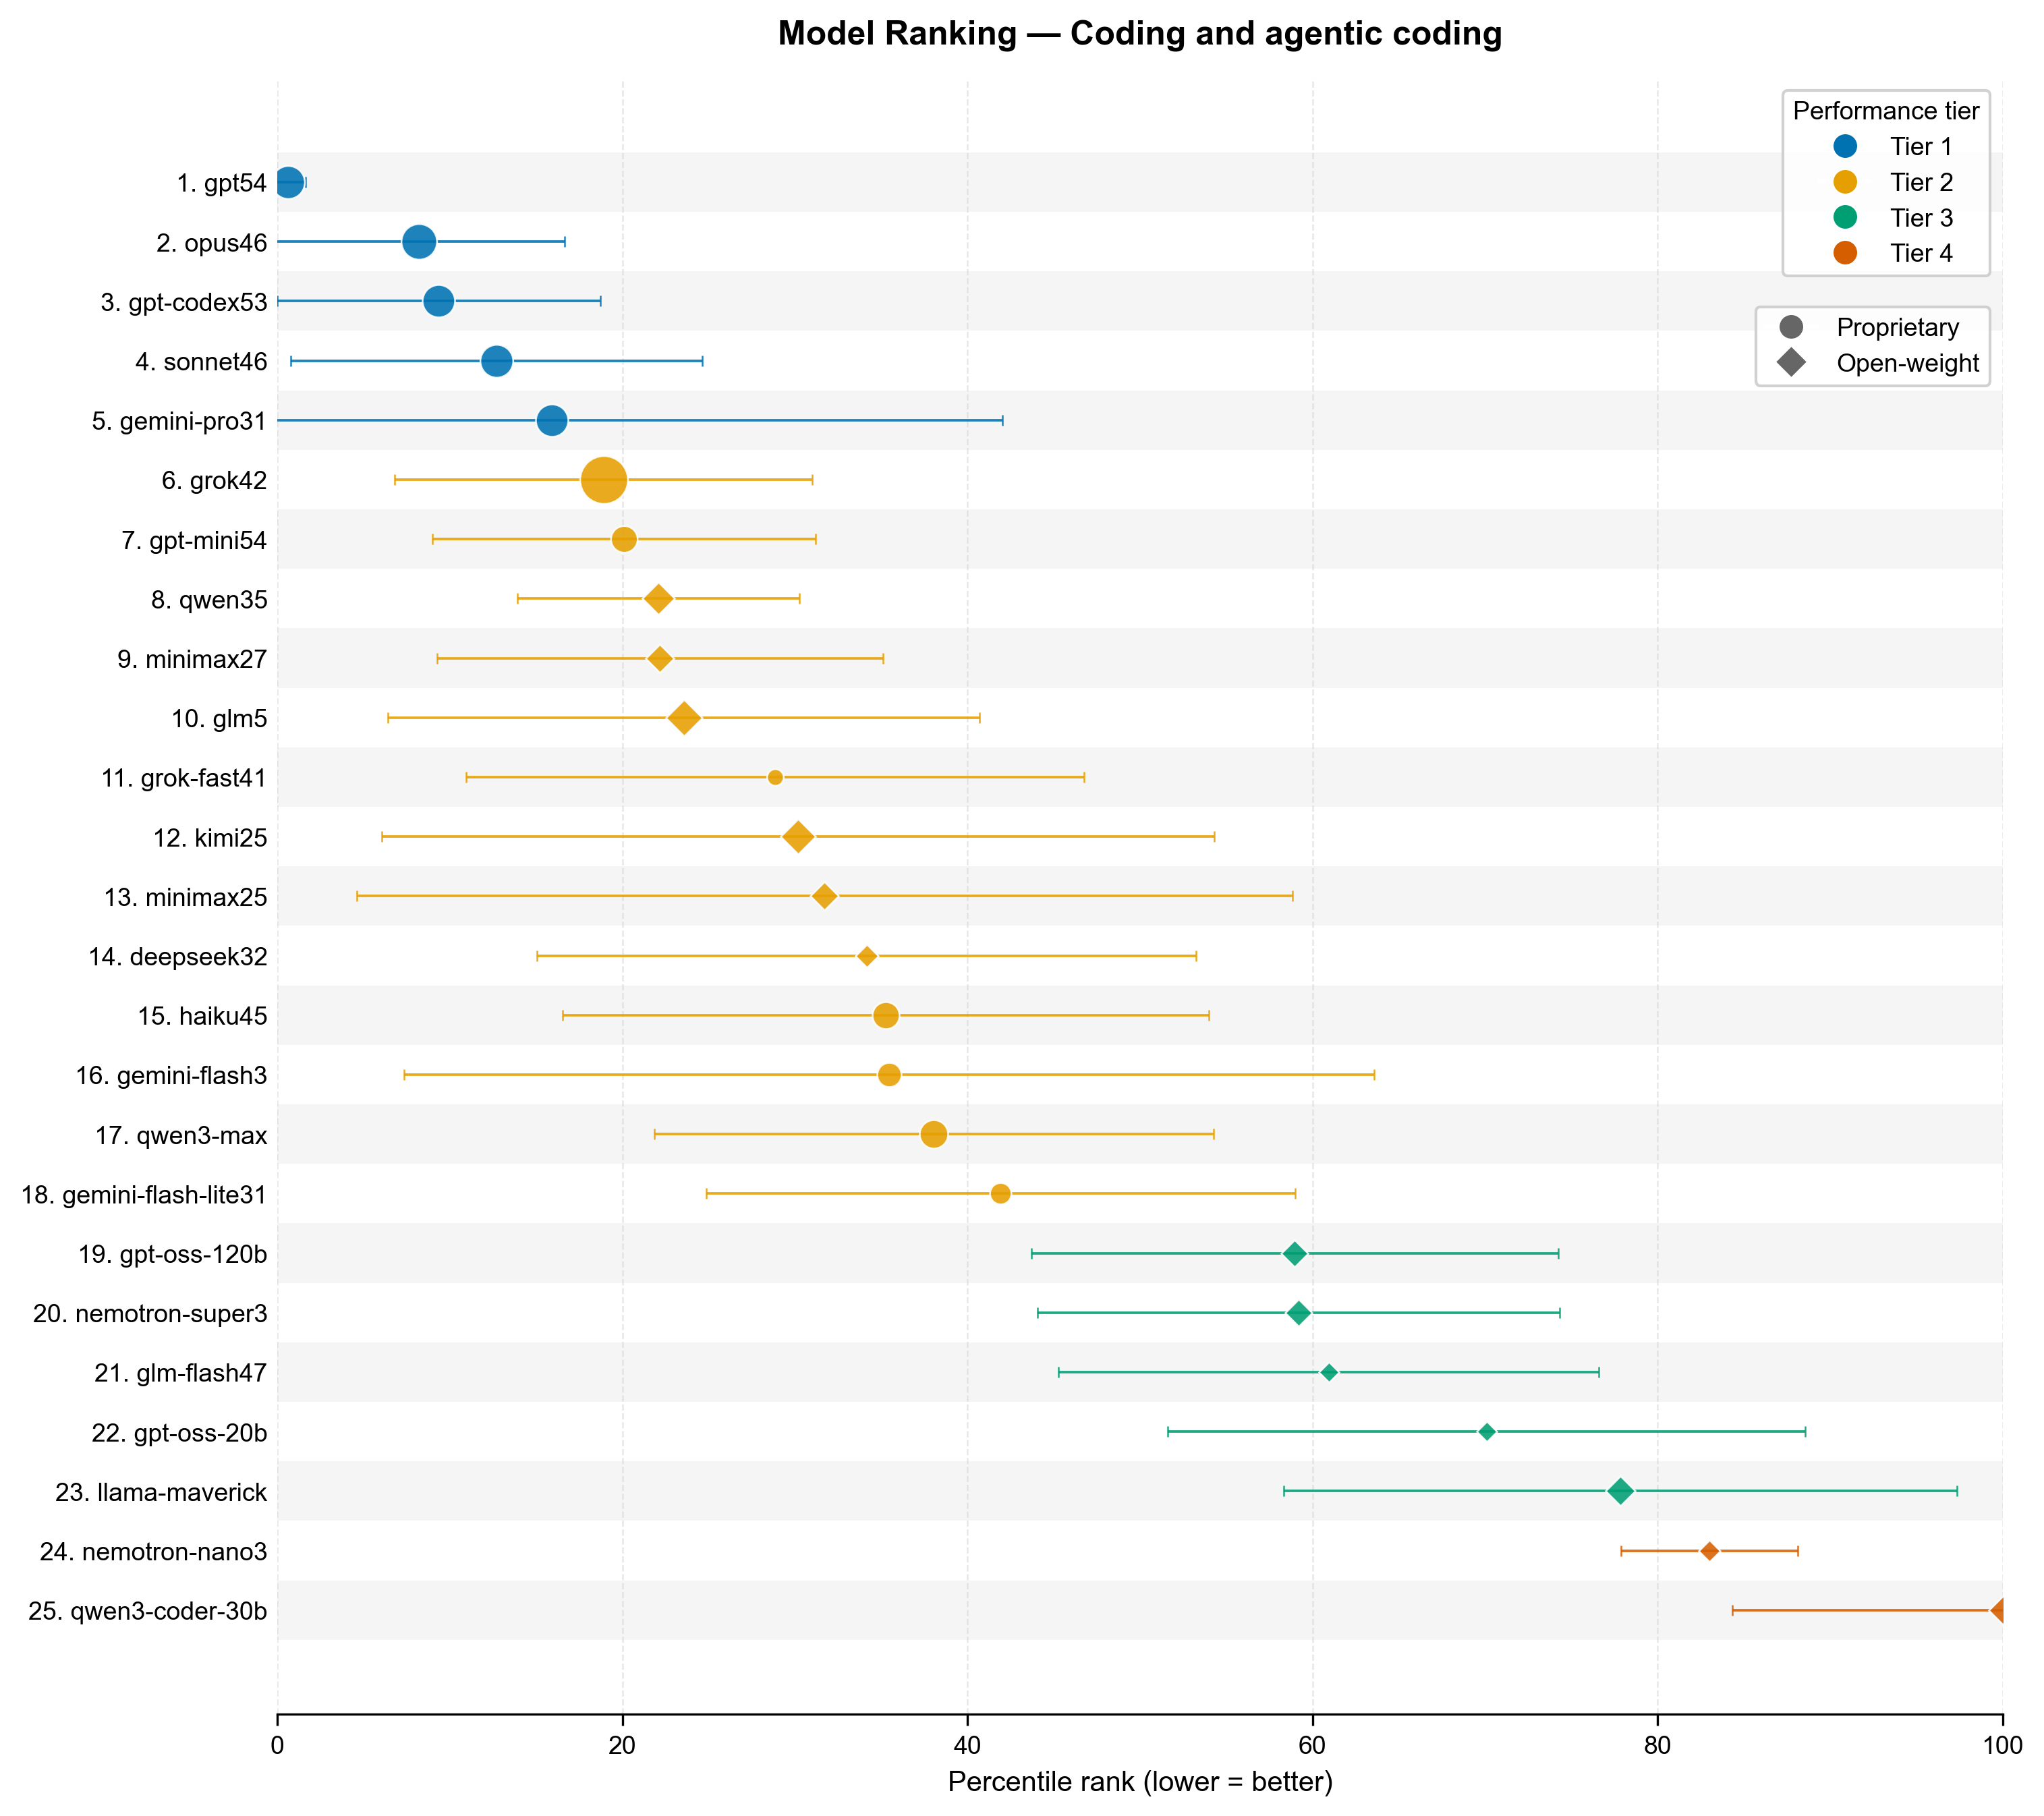
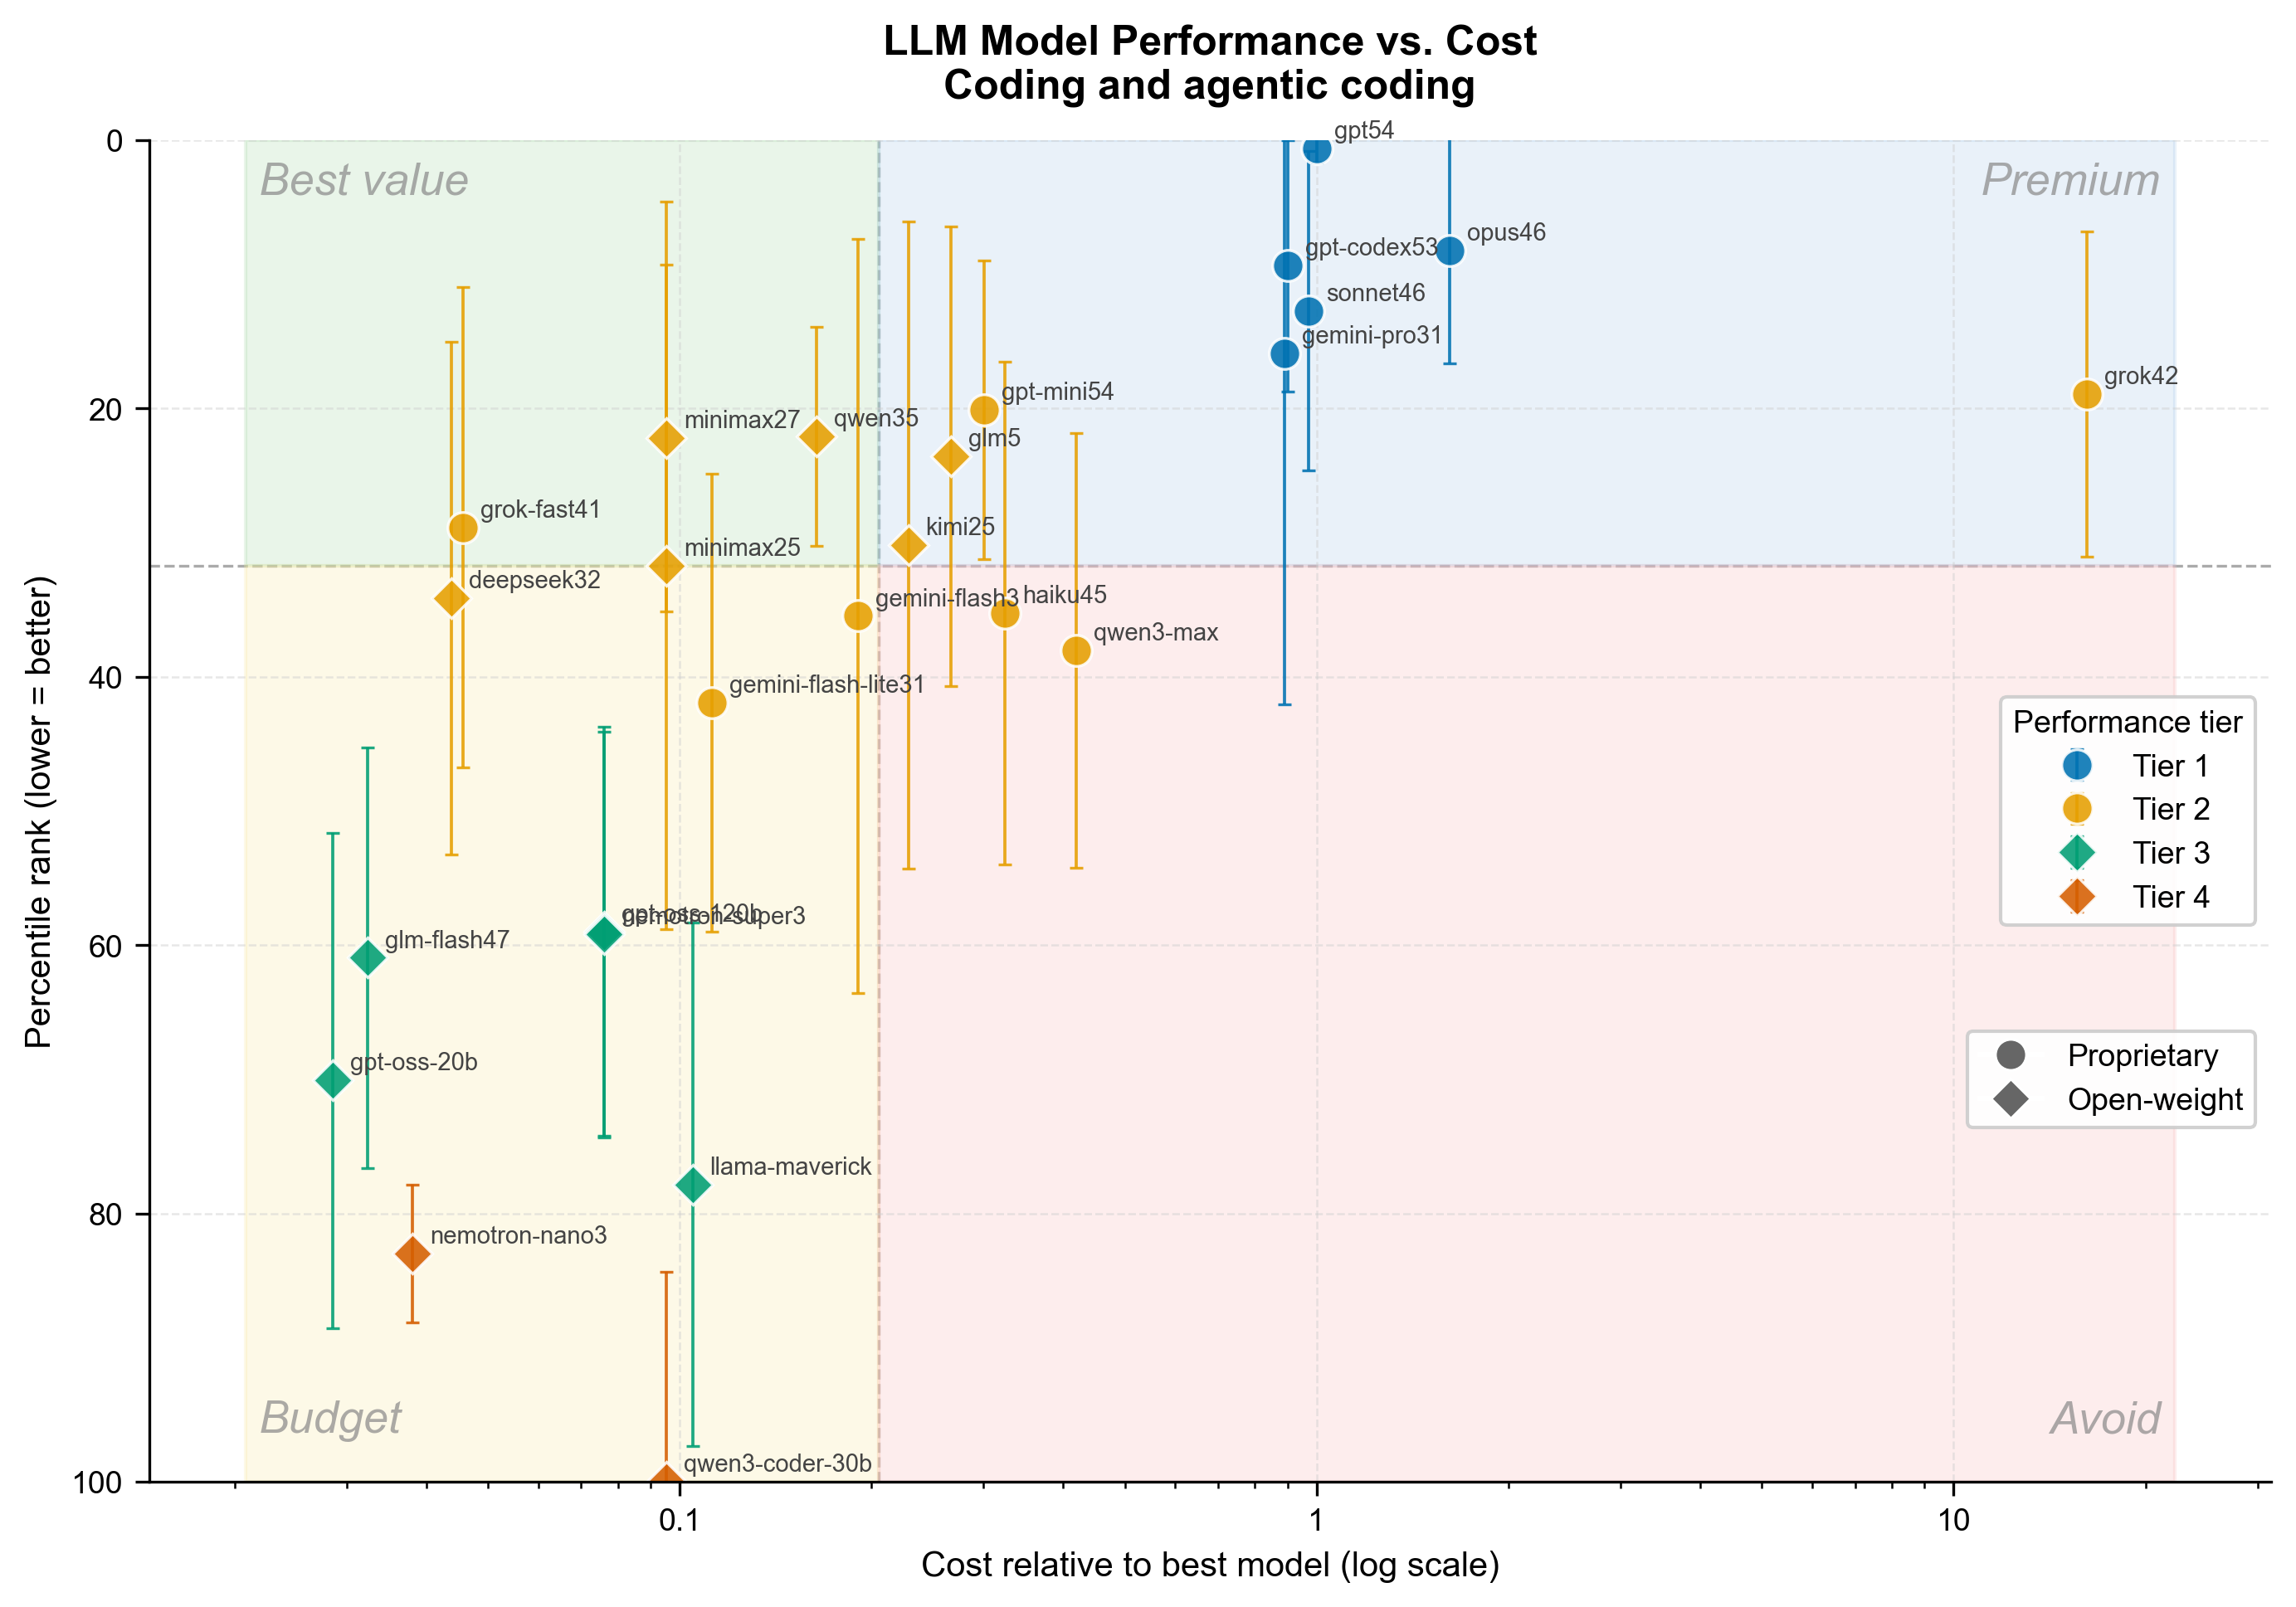
Figure 2: Same conventions as Figure 1.
Methods
Benchmark selection and data collection
I manually collected model rankings from established LLM leaderboards on February 11, 2026, choosing benchmarks that cover different evaluation angles.
General reasoning draws on four leaderboards:
- LiveBench — regularly refreshed, multi-domain evaluation designed to resist contamination
- Arena — ELO-style ranking from blind human preference votes (a popular-preference signal rather than a strict accuracy benchmark, but informative nonetheless)
- Artificial Analysis Intelligence Index — a composite of 10 evaluations including GPQA Diamond, Humanity’s Last Exam, SciCode, and others
- Scale’s Humanity’s Last Exam — expert-level reasoning questions
Coding and agentic coding draws on seven leaderboards:
- The three leaderboards previously mentioned (using coding-specific subcategories where applicable) plus four focused evaluations below.
- Scale’s SWE Bench Pro Public
- Berkeley Function-Calling Leaderboard (BFCL) — tool and function call accuracy
- SWE-bench Verified — real-world GitHub issue resolution
- Terminal-Bench 2.0 — agentic terminal and shell-based coding tasks
I selected 20+ models spanning the current frontier: proprietary leaders from OpenAI (GPT-5.2+ family), Anthropic (Claude 4.5+ family), Google (Gemini 3), and xAI (Grok 4+), plus open-weights challengers from DeepSeek, Moonshot AI (Kimi), Z AI (GLM), MiniMax, Alibaba (Qwen3+), and Meta/NVIDIA (Llama 4).
Percentile normalization
Different leaderboards evaluate different numbers of models. Being ranked 5th out of 600 models is far more impressive than 5th out of 30. To make cross-benchmark comparisons fair, I normalize each rank to a fractional percentile:
\[\text{percentile} = \frac{\text{rank}}{\text{total models evaluated}}\]This puts every score on a 0–1 scale (0 = best, 1 = worst). A model that’s 3rd out of 600 on Arena (percentile 0.005) and 2nd out of 50 on LiveBench (percentile 0.04) now live on the same axis.
Aggregation and penalties
A model’s composite score is the unweighted arithmetic mean of its percentiles across all benchmarks it appears on. To avoid boosting the ranking of a model that happens to score well on the single benchmark it was evaluated on, a sparse-data penalty is added: +0.25 for one benchmark, +0.10 for two, and zero for three or more.
Statistical tiering
Rather than treating every rank difference as meaningful, I group models into tiers using the “indistinguishable from best” method:
- The best model becomes the tier leader.
- Every remaining model whose \(\pm 1\sigma\) confidence interval overlaps with the leader’s joins the same tier.
- Remove the tier, promote the next-best model to leader, and repeat.
Formally, model i is grouped with leader j if:
\[\text{score}_i + \sigma_i \geq \text{score}_j - \sigma_j\]In plain terms: if B’s best-case performance could plausibly reach A’s worst-case, we can’t confidently distinguish them. This acknowledges that benchmark scores carry noise and avoids drawing artificial distinctions where the evidence doesn’t support them. Models evaluated on fewer than two benchmarks have no standard deviation, so the average σ across all other models is used as a stand-in.
Cost metric
For consistent cost comparison, I use the credit cost per 1,000 tokens from a single API provider (Poe) as a uniform pricing reference. Absolute dollar costs vary by provider and plan, but this gives a stable relative comparison across all models on the same platform.
Conclusions
- If you need the absolute best coding reliability and can afford it, Claude Opus 4.6 earns its price. It ranks consistently at tier 1.
- For general reasoning, you have several affordable options: Kimi K2.5, GLM-5 deliver Tier 2 performance at a fraction of the cost. Also competitive: Gemini Flash 3 and Qwen 3 Max.
- For coding and agentic coding (e.g. opencode), there are many options with great value: Gemini Flash 3, Kimi K2.5, GLM-5, MiniMax M2.5 and Qwen 3.5.
- If budget is the primary concern, DeepSeek V3.2 and Grok 4.1 Fast offer the standout value of this generation.
Reproducibility
All code, data files, and full methodology details are here.